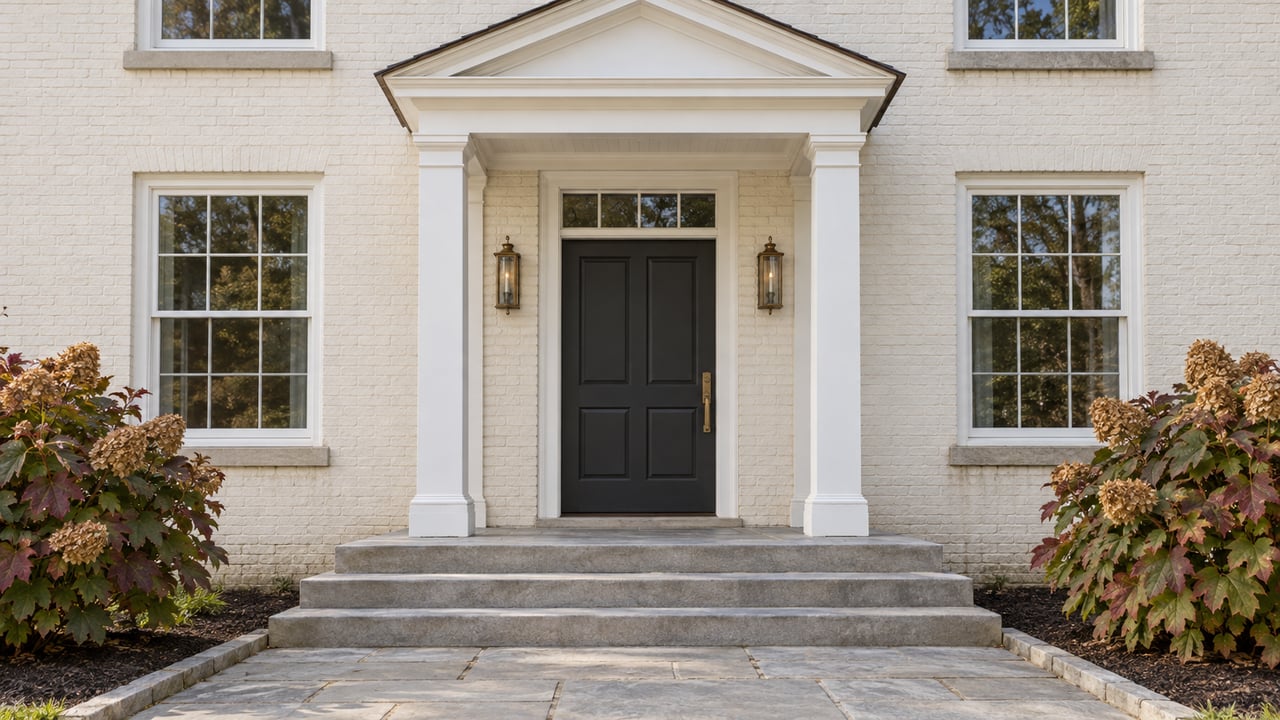
New Albany's Median Price Jumped This Year. The Price Per Square Foot Didn't.
October 8, 2026
October 8, 2026
Through the first eight months of 2026, the median sale price in the City of New Albany rose 18.8%, from $800,000 to $950,000. Over the same stretch, the average price per square foot rose 0.5%, from $304.51 to $306.01. One number says the market took a big step up, and the other says it barely moved. Both come from the same Columbus REALTORS® report for August 2026.
The per-foot figure tells the more accurate story for anyone pricing a home here. New Albany's median shows which homes happened to close in a given stretch of months. In a city with about 150 sales a year, that mix can change a lot from one year to the next. The same thing happened in 2025, with the numbers moving the other way.
Put the two years side by side and the pattern is plain. In 2025 the median fell while price per foot rose. In 2026 the median rose while price per foot barely moved.
City of New Albany | Full year 2025 vs. 2024 | Jan. to Aug. 2026 vs. same period 2025 |
|---|---|---|
Median sales price | Down 5.9%, to $800,000 | Up 18.8%, to $950,000 |
Average sales price | Up 8.3%, to $1,073,444 | Up 3.0%, to $1,162,324 |
Average price per square foot | Up 5.0%, to $297.44 | Up 0.5%, to $306.01 |
Closed sales | 155 | 117 |
The 2025 figures come from the city's own 2026 budget, which reprints the full-year Columbus REALTORS® table for New Albany. If you had read only the median, you would have concluded that New Albany softened in 2025 and then surged in 2026. Per-foot pricing shows a steady gain in 2025 and a flat 2026.
A home's price is roughly its size multiplied by its price per foot. If the middle price jumps nearly a fifth while the per-foot number holds, the homes in the middle of this year's sales list were most likely larger, or sat in higher-priced parts of the city, than last year's. That points to a change in which homes sold, not a rise in what each square foot is worth.
August on its own shows the gap even more clearly. The August 2026 median was $992,501, up 18.8% from August 2025. The average price for the month was essentially unchanged at $1,243,182, and average price per square foot fell 5.4%, to $306.66. A homeowner reading the August median would think their house gained value. The per-foot number points the other way.
The mix change shows up in listings first. Through August 2026, the median list price of newly listed homes in New Albany was $1,050,000, up from $825,000 in the same period of 2025. New listings rose 24.8%, from 125 to 156.
More homes came to market, and the typical new listing was priced well above last year's. The report doesn't break listings down by size or location, but a rising list-price median alongside a flat per-foot sale price fits a supply shift toward larger homes. Buyers paid about the same per foot. They bought more feet.
The other measures of demand point to a market that is busy but not overheated:
At the end of 2025, the same report showed 13 homes for sale and 1.0 month of supply. New Albany buyers now have roughly twice the selection they had at the start of the year, and well-priced homes still sell in about three weeks. A real price jump would look different. You would expect per-foot pricing to rise and the share of list price received to climb. Neither happened.
The Columbus REALTORS® report warns about this itself. Its footnote says percent changes are calculated from rounded figures and "can sometimes look extreme due to small sample size."
New Albany's sample is small. The city recorded 155 closed sales in all of 2025 and 22 in August 2026. In a month with 22 sales, the median is the price of the eleventh or twelfth home. A few estate-scale closings on one side of that line can move it by six figures. The budget notes the city has more than 3,800 homes at 0.28 homes per acre, and only about 155 of them changed hands in 2025. Each year's sales are a thin slice of a varied housing stock, and the median moves with the slice.
Price per square foot evens out much of that. It doesn't care whether the month's sales leaned toward 6,000-square-foot estates or smaller homes. That is why it moved 5.0% and then 0.5% while the median swung from a 5.9% drop to an 18.8% gain.
The next test of this is already approved. On July 20, 2026, the New Albany Planning Commission approved Edgehill, a 243-unit plan from M/I Homes with the New Albany Company, at 9582 Johnstown Road. The Columbus Dispatch reported the approval the next morning.
City staff describe a 58.4-acre undeveloped site in the Village Center district of the city's strategic plan. It sits near the corner of East Dublin-Granville Road and Kitzmiller Road, with a future Nationwide Children's Hospital site to the north. The plan calls for 94 detached single-family homes and 149 townhomes in seven phases. The first phase, 1A, has 18 single-family homes and 28 townhomes.
Home size is what matters for the median. At the Architectural Review Board, M/I Homes chief product architect Dan O'Malley said the homes will have a Georgian theme and run 1,960 to 2,100 square feet. M/I Homes told the Planning Commission that the townhome design has not been built in Columbus before and that interior units are 22 feet wide. The plan also sets aside about 21 acres of parkland, including creek headwaters and a conservation easement.
No pricing has been published, and the Edgehill records reviewed give no construction start or first-delivery date. When an ARB member asked about the cost difference between the two home types, Tom Rubey, the New Albany Company's director of development, said he was not sure. Even so, the direction is clear. Homes of about 2,000 square feet, sold at anything near the city's recent average of about $306 per foot, would close well below a $950,000 median. Once Edgehill phases start closing, a growing share of New Albany's small yearly sales count will be compact homes. The median could drop noticeably in a year when every existing home holds its value.
Edgehill is not the only addition. On August 4, 2026, City Council adopted ordinance O-27-2026, which renews the final plat for Section 30 at 40 single-family lots on about 30.1 acres. It took effect September 3. Each new group of closings changes the mix the median is measuring.
The practical point is the same for buyers and sellers. In New Albany, use the median to judge the market's general price level, and use per-foot pricing and comparable sales to judge an individual home.
It covers the City of New Albany across its Franklin and Licking county portions in one combined report. Columbus REALTORS® publishes other New Albany-area geographies separately, and their medians differ, so check which boundary a figure describes before comparing it.
The city records reviewed do not give a start or delivery date. The staff report says park and basin design still has to come back to the Planning Commission.
Not by these numbers. Homes are selling faster than a year ago and close to list price. Buyers have more to choose from than at any point covered in these reports, but sellers have not lost pricing power.
If you are thinking about selling in New Albany this fall, your home's value comes from its size, location and finish compared with recent sales of similar homes, not from the citywide median. Angel Perez and the Perez Team will prepare a free home valuation built on comparable New Albany sales and per-foot pricing, so your list price reflects what your home is likely to sell for.
Stay up to date on the latest real estate trends.
Etiam non quam lacus suspendisse faucibus interdum. Orci ac auctor augue mauris augue neque. Bibendum at varius vel pharetra. Viverra orci sagittis eu volutpat.
Get in Touch With Us to Learn More
8800 Lyra Drive Suite 600 Columbus, Ohio 43240